How often do you see a positive financial news headline? The ‘media’ (a broad term today) thrives on emotional headlines to capture people’s attention and sell advertising (or clicks!).
If the Australian equity market falls 3% in a day you can bet it will make the headlines (‘share market blood bath’ or ‘$X billion wiped out!’).
If the market increases 3% how often do you see the contrary headline of ‘share market adds $X billion!’ or ‘investors make solid gains’?
A large portion of financial headlines are short term noise which can cause people to react and make long term wealth destructing decisions. This phenomenon is further compounded by the numerous share trading software programs and ‘Rivkin’ type newsletters which promise the hope of ‘expert instruction’ of what company, commodity or vintage red wine to buy and when.
This all said here are a few facts for the last 12 months to May 2013 you may not know due to the bias in reporting:
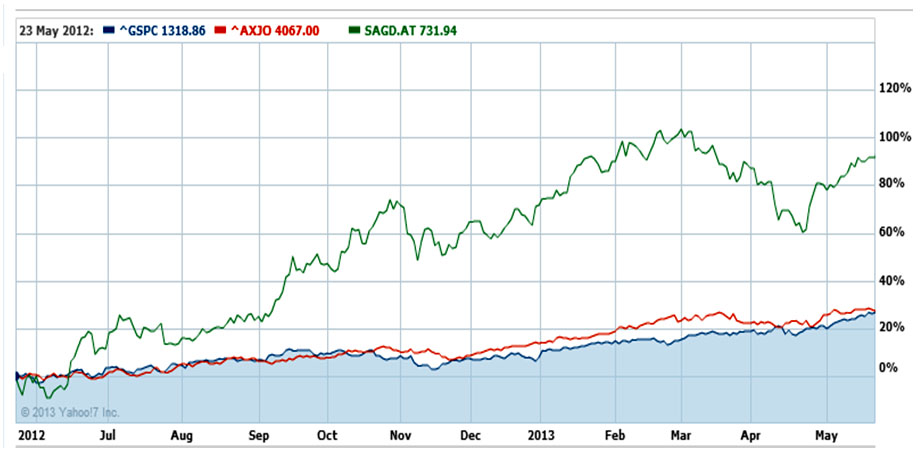
- The 200 largest companies on the Australian equities market have returned +23% (red below). This is at a time when share ownership in Australia has decreased from 43% in 2010 to 38% in 2012.
- The 500 largest companies on the US market have returned +23% (before currency movement which increase this return) and has reached new highs eclipsing the GFC levels (blue below).
- The 50 largest companies on the Athen’s market have returned +100% despite the Greek political and economic ‘crisis’ we have heard so often reported (green below).

The market movements reflect the concerted government efforts to restore stability to the world financial system and to stimulate the economy to rebuild confidence and get businesses and consumers investing again.
Interest Rates
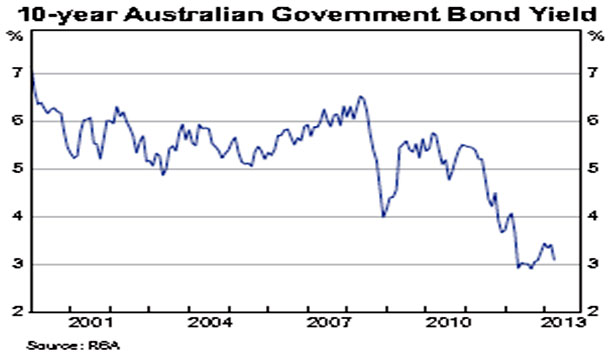
The average return on a 6 month term deposit has dropped 18% since May 2012 (from 5% to 4.1% today) which is similarly reflected in lower borrowing costs. This is highlighted in the chart below.

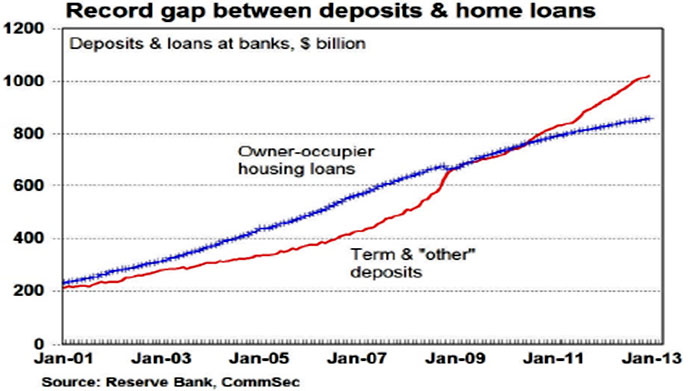
Despite record low cash rates of return the value of cash deposits continues to climb as evidenced by a recent RBA chart below.

