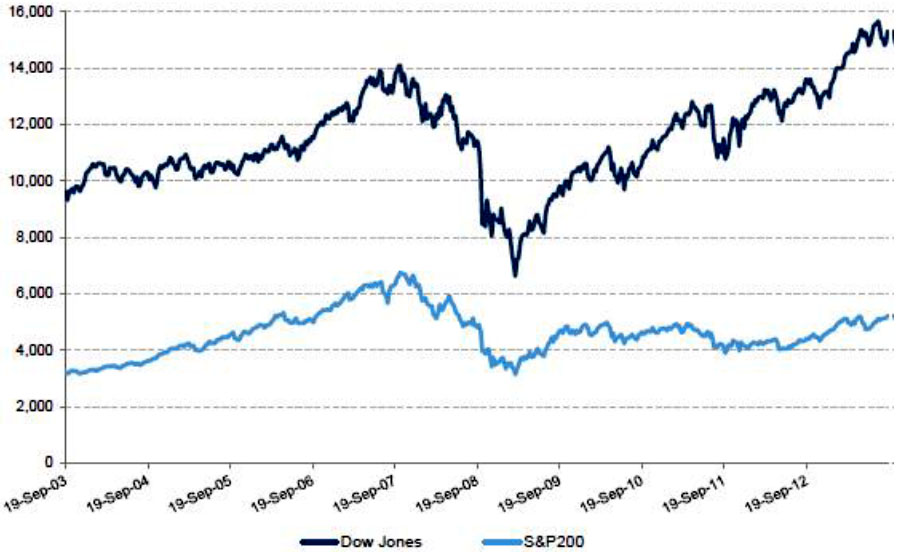
Have you wondered why the Australian market appears to have lagged the US this year? The US Dow Jones Index continues to set all time highs having passed its pre-GFC high in February 2013 whilst the Australian ASX 200 remains some 25% below its pre-GFC high as shown in the following price only chart:

Dow Jones vs S&P/ASX200 Source IRESS
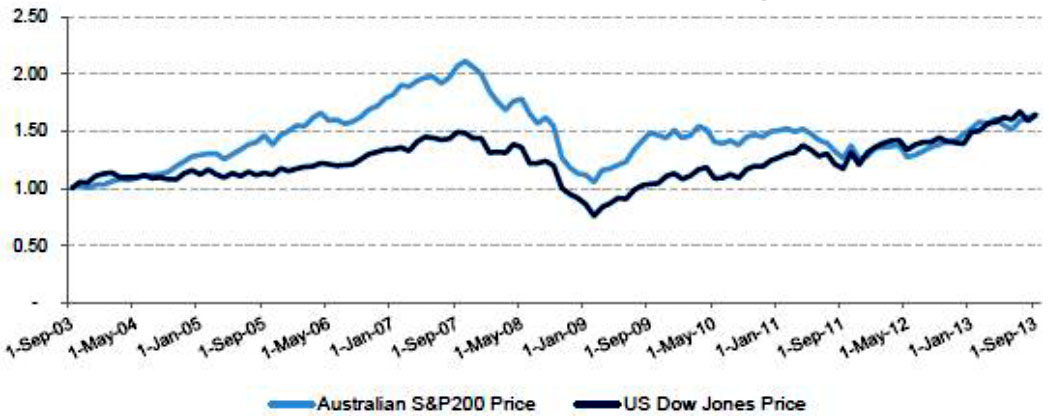
If the comparison of the two markets is converted to a common base from 2003, interestingly they almost track in line with each other with both indices up around 65% over the past 10 years:

Dow Jones vs S&P/ASX200 in common base terms Source: Iress. Common base 1 September 2003.
Accumulation Indices Include Dividends
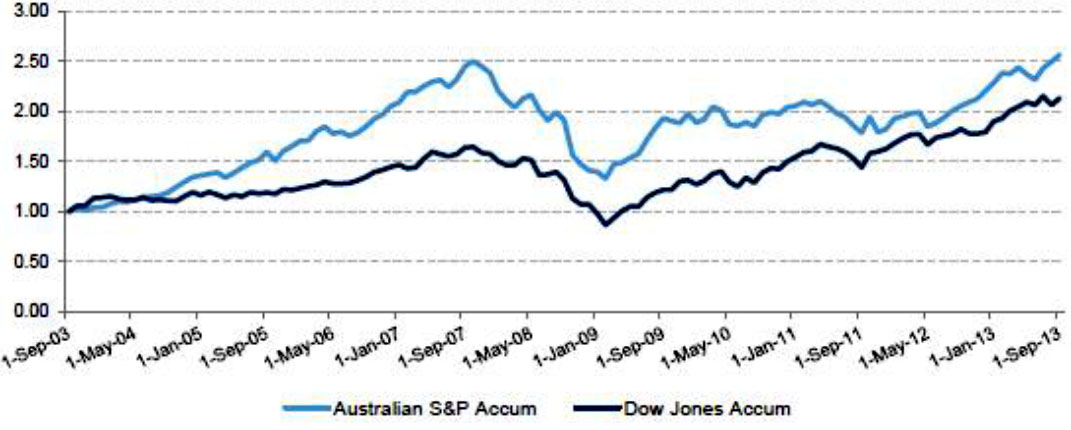
In newspapers and TV the commonly reported indices include capital price only, but not dividends. In comparing the accumulation indices, the higher yielding Australian market has significantly outperformed the US Dow Jones. The Australian market is up around 150% and the Dow Jones accumulated is up around 110% over the same 10 year period.

Dow Jones vs S&P/ASX200 Accumulation Indices in common base. Source: Iress.
Franking Credits Add More Value For Low Tax Investors
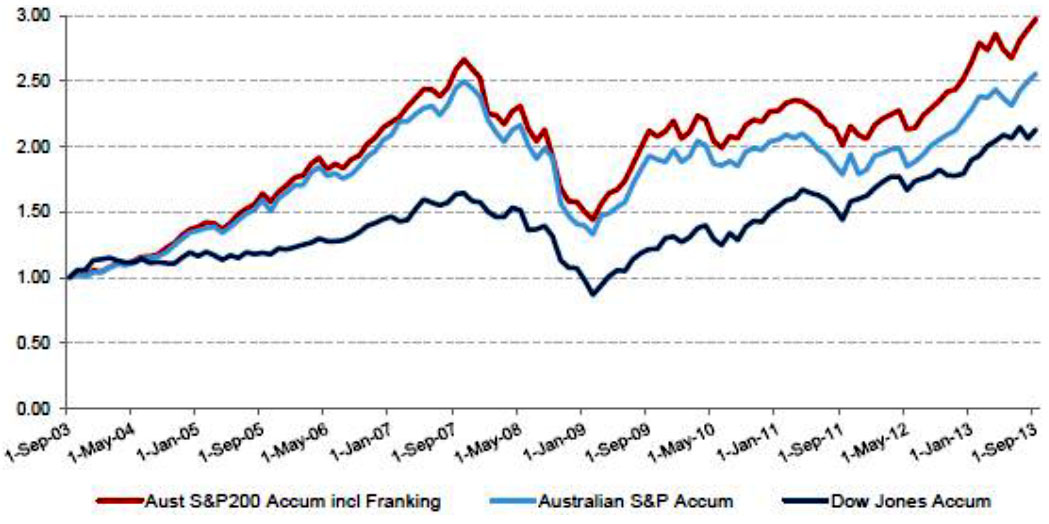
If you include franking credits there’s even more upside for Australian investors. Over the 10-year period shown, franking credits improved the accumulated return on the ASX 200 by over 40%. Franking credits improved compound returns by approximately 1.7% per annum, highlighting the value of franking and the power of compounding returns. The next chart highlights these differences.

Dow Jones vs S&P/ASX200 Accumulation indices including franking credits in common base terms.
On a total return basis the Australian market set a new high both excluding and including franking credits in October 2013 and this highlights the total return buy-and-hold investors would have achieved, which has more than made up for the GFC declines.
